Android UI卡顿监测框架BlockCanary原理分析

本文转载自:https://www.jianshu.com/p/e58992439793

BlockCanary是国内开发者MarkZhai开发的一套性能监控组件,它对主线程操作进行了完全透明的监控,并能输出有效的信息,帮助开发分析、定位到问题所在,迅速优化应用。
其特点有:

  • 非侵入式,简单的两行就打开监控,不需要到处打点,破坏代码优雅性。
  • 精准,输出的信息可以帮助定位到问题所在(精确到行),不需要像Logcat一样,慢慢去找。目前包括了核心监控输出文件,以及UI显示卡顿信息功能

基本使用

使用非常方便,引入

1
2
3
4
5
6
7
dependencies {
compile 'com.github.markzhai:blockcanary-android:1.5.0'

// 仅在debug包启用BlockCanary进行卡顿监控和提示的话,可以这么用
debugCompile 'com.github.markzhai:blockcanary-android:1.5.0'
releaseCompile 'com.github.markzhai:blockcanary-no-op:1.5.0'
}

在应用的application中完成初始化

1
2
3
4
5
6
7
8
9
10
11
12
13
14
15
16
17
18
19
20
21
22
23
24
25
26
27
28
29
30
31
32
33
34
35
36
37
38
39
40
41
public class DemoApplication extends Application {

@Override
public void onCreate() {
super.onCreate();
BlockCanary.install(this, new AppContext()).start();
}
}

//参数设置
public class AppContext extends BlockCanaryContext {
private static final String TAG = "AppContext";

@Override
public String provideQualifier() {
String qualifier = "";
try {
PackageInfo info = DemoApplication.getAppContext().getPackageManager()
.getPackageInfo(DemoApplication.getAppContext().getPackageName(), 0);
qualifier += info.versionCode + "_" + info.versionName + "_YYB";
} catch (PackageManager.NameNotFoundException e) {
Log.e(TAG, "provideQualifier exception", e);
}
return qualifier;
}

@Override
public int provideBlockThreshold() {
return 500;
}

@Override
public boolean displayNotification() {
return BuildConfig.DEBUG;
}

@Override
public boolean stopWhenDebugging() {
return false;
}
}

基本原理

我们都知道Android应用程序只有一个主线程ActivityThread,这个主线程会创建一个Looper(Looper.prepare),而Looper又会关联一个MessageQueue,主线程Looper会在应用的生命周期内不断轮询(Looper.loop),从MessageQueue取出Message 更新UI。
我们来看一个代码片段

1
2
3
4
5
6
7
8
9
10
11
12
13
14
15
16
17
public static void loop() {
...
for (;;) {
...
// This must be in a local variable, in case a UI event sets the logger
Printer logging = me.mLogging;
if (logging != null) {
logging.println(">>>>> Dispatching to " + msg.target + " " +
msg.callback + ": " + msg.what);
}
msg.target.dispatchMessage(msg);
if (logging != null) {
logging.println("<<<<< Finished to " + msg.target + " " + msg.callback);
}
...
}
}

msg.target其实就是Handler,看一下dispatchMessage的逻辑

1
2
3
4
5
6
7
8
9
10
11
12
13
14
15
/**
* Handle system messages here.
*/
public void dispatchMessage(Message msg) {
if (msg.callback != null) {
handleCallback(msg);
} else {
if (mCallback != null) {
if (mCallback.handleMessage(msg)) {
return;
}
}
handleMessage(msg);
}
}
  • 如果消息是通过Handler.post(runnable)方式投递到MQ中的,那么就回调runnable#run方法;
  • 如果消息是通过Handler.sendMessage的方式投递到MQ中,那么回调handleMessage方法;

不管是哪种回调方式,回调一定发生在UI线程。因此如果应用发生卡顿,一定是在dispatchMessage中执行了耗时操作。我们通过给主线程的Looper设置一个Printer,打点统计dispatchMessage方法执行的时间,如果超出阀值,表示发生卡顿,则dump出各种信息,提供开发者分析性能瓶颈。

1
2
3
4
5
6
7
8
9
10
11
12
13
14
15
16
17
18
@Override
public void println(String x) {
if (!mStartedPrinting) {
mStartTimeMillis = System.currentTimeMillis();
mStartThreadTimeMillis = SystemClock.currentThreadTimeMillis();
mStartedPrinting = true;
} else {
final long endTime = System.currentTimeMillis();
mStartedPrinting = false;
if (isBlock(endTime)) {
notifyBlockEvent(endTime);
}
}
}

private boolean isBlock(long endTime) {
return endTime - mStartTimeMillis > mBlockThresholdMillis;
}

源码分析

源码分析主要分为框架初始化过程和监控过程

框架初始化过程

初始化过程主要通过下面第一行代码发起

1
BlockCanary.install(this, new AppContext()).start();

在内部我们细分为install和start过程

install

1
2
3
4
5
6
7
8
9
10
11
12
13
14
15
16
17
18
19
20
21
22
23
24
25
public static BlockCanary install(Context context, BlockCanaryContext blockCanaryContext) {
BlockCanaryContext.init(context, blockCanaryContext);
setEnabled(context, DisplayActivity.class, BlockCanaryContext.get().displayNotification());
return get();
}

private static void setEnabled(Context context,
final Class<?> componentClass,
final boolean enabled) {
final Context appContext = context.getApplicationContext();
executeOnFileIoThread(new Runnable() {
@Override
public void run() {
setEnabledBlocking(appContext, componentClass, enabled);
}
});
}

private static void setEnabledBlocking(Context appContext,Class<?> componentClass,boolean enabled) {
ComponentName component = new ComponentName(appContext, componentClass);
PackageManager packageManager = appContext.getPackageManager();
int newState = enabled ? COMPONENT_ENABLED_STATE_ENABLED : COMPONENT_ENABLED_STATE_DISABLED;
// Blocks on IPC.
packageManager.setComponentEnabledSetting(component, newState, DONT_KILL_APP);
}
  • BlockCanaryContext.init会将保存应用的applicationContext和用户设置的配置参数;
  • setEnabled将根据用户的通知栏消息配置开启(displayNotification=true)或关闭(displayNotification=false)DisplayActivity (DisplayActivity是承载通知栏消息的activity)

注意该设置过程需要提交到一个单线程的IO线程池去执行。

接下来是外观类BlockCanary的创建过程

1
2
3
4
5
6
7
8
9
10
11
12
13
14
15
16
17
18
19
20
21
public static BlockCanary get() {
if (sInstance == null) {
synchronized (BlockCanary.class) {
if (sInstance == null) {
sInstance = new BlockCanary();
}
}
}
return sInstance;
}
//私有构造函数
private BlockCanary() {
BlockCanaryInternals.setContext(BlockCanaryContext.get());
mBlockCanaryCore = BlockCanaryInternals.getInstance();
mBlockCanaryCore.addBlockInterceptor(BlockCanaryContext.get());
if (!BlockCanaryContext.get().displayNotification()) {
return;
}
mBlockCanaryCore.addBlockInterceptor(new DisplayService());

}
  • 单例创建BlockCanary
  • 核心处理类为BlockCanaryInternals
  • 为BlockCanaryInternals添加拦截器(责任链)
  • BlockCanaryContext对BlockInterceptor是空实现,可以忽略;
  • DisplayService只在开启通知栏消息的时候添加,当卡顿发生时将通过DisplayService发起通知栏消息

接下来看核心类BlockCanaryInternals的初始化过程。

1
2
3
4
5
6
7
8
9
10
11
12
13
14
15
16
17
18
19
20
21
22
23
24
25
26
27
28
29
30
31
32
33
34
35
36
public BlockCanaryInternals() {

stackSampler = new StackSampler(
Looper.getMainLooper().getThread(),
sContext.provideDumpInterval());

cpuSampler = new CpuSampler(sContext.provideDumpInterval());

setMonitor(new LooperMonitor(new LooperMonitor.BlockListener() {

@Override
public void onBlockEvent(long realTimeStart, long realTimeEnd,
long threadTimeStart, long threadTimeEnd) {
// Get recent thread-stack entries and cpu usage
ArrayList<String> threadStackEntries = stackSampler
.getThreadStackEntries(realTimeStart, realTimeEnd);
if (!threadStackEntries.isEmpty()) {
BlockInfo blockInfo = BlockInfo.newInstance()
.setMainThreadTimeCost(realTimeStart, realTimeEnd, threadTimeStart, threadTimeEnd)
.setCpuBusyFlag(cpuSampler.isCpuBusy(realTimeStart, realTimeEnd))
.setRecentCpuRate(cpuSampler.getCpuRateInfo())
.setThreadStackEntries(threadStackEntries)
.flushString();
LogWriter.save(blockInfo.toString());

if (mInterceptorChain.size() != 0) {
for (BlockInterceptor interceptor : mInterceptorChain) {
interceptor.onBlock(getContext().provideContext(), blockInfo);
}
}
}
}
}, getContext().provideBlockThreshold(), getContext().stopWhenDebugging()));

LogWriter.cleanObsolete();
}

创建了两个采样类StackSampler和CpuSampler,即线程堆栈采样和CPU采样。

随后创建一个LooperMonitor,LooperMonitor实现了android.util.Printer接口。

随后通过调用setMonitor把创建的LooperMonitor赋值给BlockCanaryInternals的成员变量monitor。

start

即调用BlockCanary的start方法

1
2
3
4
5
6
public void start() {
if (!mMonitorStarted) {
mMonitorStarted = true;
Looper.getMainLooper().setMessageLogging(mBlockCanaryCore.monitor);
}
}

将在BlockCanaryInternals中创建的LooperMonitor给主线程Looper的mLogging变量赋值。这样主线程Looper就可以消息分发前后使用LooperMonitor#println输出日志。

卡顿监控过程

根据上面原理的分析,监控的对象主要是Main Looper的Message分发耗时情况。

1
2
3
4
5
6
7
8
9
10
11
12
13
14
15
16
17
//Looper
for (;;) {
Message msg = queue.next();
// This must be in a local variable, in case a UI event sets the logger
Printer logging = me.mLogging;
if (logging != null) {
logging.println(">>>>> Dispatching to " + msg.target + " " +
msg.callback + ": " + msg.what);
}

msg.target.dispatchMessage(msg);

if (logging != null) {
logging.println("<<<<< Finished to " + msg.target + " " + msg.callback);
}
...
}

主线程的所有消息都在这里调度!!

每从MQ中取出一个消息,由于我们设置了Printer为LooperMonitor,因此在调用dispatchMessage前后都可以交由我们LooperMonitor接管。

我们再次从下面这段代码入手。

1
2
3
4
5
6
7
8
9
10
11
12
13
14
15
16
17
18
19
@Override
public void println(String x) {
if (mStopWhenDebugging && Debug.isDebuggerConnected()) {
return;
}
if (!mPrintingStarted) {
mStartTimestamp = System.currentTimeMillis();
mStartThreadTimestamp = SystemClock.currentThreadTimeMillis();
mPrintingStarted = true;
startDump();
} else {
final long endTime = System.currentTimeMillis();
mPrintingStarted = false;
if (isBlock(endTime)) {
notifyBlockEvent(endTime);
}
stopDump();
}
}

对于单个Message而言,这个方法一定的成对调用的。

卡顿监控记录

第一次调用时,记录开始时间,并开始dump堆栈和CPU信息。

1
2
3
4
5
6
7
8
9
10
11
12
13
14
15
16
17
18
19
20
21
22
23
24
25
26
27
28
29
30
31
32
33
34
//LooperMonitor
private void startDump() {
if (null != BlockCanaryInternals.getInstance().stackSampler) {
BlockCanaryInternals.getInstance().stackSampler.start();
}

if (null != BlockCanaryInternals.getInstance().cpuSampler) {
BlockCanaryInternals.getInstance().cpuSampler.start();
}
}

//AbstractSampler
public void start() {
if (mShouldSample.get()) {
return;
}
mShouldSample.set(true);

HandlerThreadFactory.getTimerThreadHandler().removeCallbacks(mRunnable);
HandlerThreadFactory.getTimerThreadHandler().postDelayed(mRunnable,
BlockCanaryInternals.getInstance().getSampleDelay());
}

private Runnable mRunnable = new Runnable() {
@Override
public void run() {
doSample();

if (mShouldSample.get()) {
HandlerThreadFactory.getTimerThreadHandler()
.postDelayed(mRunnable, mSampleInterval);
}
}
};
  • 两种采样依次提交到HandlerThread中进行,从而保证采样过程是在一个后台线程执行;
  • 两种采样有个共同的父类AbstractSampler,采用了模板方法模式,即在父类定义了采样的抽象算法doSample及采样生命周期的管控(start和stop),不同的子类采样的算法实现是不一样的;
  • 采样会周期性执行,间隔时间与卡顿阀值一致(可由开发者设置);

堆栈采样

堆栈采样很简单,直接通过Main Looper获取到主线程Thread对象,调用Thread#getStackTrace即可获取到堆栈信息

1
2
3
4
5
6
7
8
9
10
11
12
13
14
15
16
17
@Override
protected void doSample() {
StringBuilder stringBuilder = new StringBuilder();

for (StackTraceElement stackTraceElement : mCurrentThread.getStackTrace()) {
stringBuilder
.append(stackTraceElement.toString())
.append(BlockInfo.SEPARATOR);
}

synchronized (sStackMap) {
if (sStackMap.size() == mMaxEntryCount && mMaxEntryCount > 0) {
sStackMap.remove(sStackMap.keySet().iterator().next());
}
sStackMap.put(System.currentTimeMillis(), stringBuilder.toString());
}
}

将堆栈拼成String,保存在LinkedHashMap中,当然保存有一定阀值,默认最多保存100条。

CPU采样

在分析代码之前我们需要先了解一下Android平台CPU的一些常识。

我们都知道Android是基于Linux系统的,Android平台关于CPU的计算是跟Linux是完全一样的。

/proc/stat文件

在Linux中CPU活动信息是保存在该文件中,该文件中的所有值都是从系统启动开始累计到当前时刻。

1
2
3
4
5
6
7
8
9
10
~$ cat /proc/stat
cpu 38082 627 27594 893908 12256 581 895 0 0
cpu0 22880 472 16855 430287 10617 576 661 0 0
cpu1 15202 154 10739 463620 1639 4 234 0 0
intr 120053 222 2686 0 1 1 0 5 0 3 0 0 0 47302 0 0 34194 29775 0 5019 845 0 0 0 0 0 0 0 0 0 0 0 0 0 0 0 0 0 0 0 0 0 0 0 0 0 0 0 0 0 0 0 0 0 0 0 0 0 0 0 0 0 0 0 0 0 0 0 0 0 0 0 0 0 0 0 0 0 0 0 0 0 0 0 0 0 0 0 0 0 0 0 0 0 0 0 0 0 0 0 0 0 0 0 0 0 0 0 0 0 0 0 0 0 0 0 0 0 0 0 0 0 0 0 0 0 0 0 0 0 0 0 0 0 0 0 0 0 0 0 0 0 0 0 0 0 0 0 0 0 0 0 0 0 0 0 0 0 0 0 0 0 0 0 0 0 0 0 0 0 0 0 0 0 0 0 0 0 0 0 0 0 0 0 0 0 0 0 0 0 0 0 0 0 0 0 0 0 0 0 0 0 0 0 0 0 0 0 0 0 0 0 0 0 0 0 0 0 0 0 0 0 0 0 0
ctxt 1434984
btime 1252028243
processes 8113
procs_running 1
procs_blocked 0

第二行的数值表示的是CPU总的使用情况,所以我们只要用第一行的数字计算就可以了

下表解析第一行各数值的含义

参数 解析 (以下数值都是从系统启动累计到当前时刻)
user (38082) 处于用户态的运行时间,不包含 nice值为负进程
nice (627) nice值为负的进程所占用的CPU时间
system (27594) 处于核心态的运行时间
idle (893908) 除IO等待时间以外的其它等待时间iowait (12256) 从系统启动开始累计到当前时刻,IO等待时间
irq (581) 硬中断时间
irq (581) 软中断时间
stealstolen(0) 一个其他的操作系统运行在虚拟环境下所花费的时间
guest(0) 这是在Linux内核控制下为客户操作系统运行虚拟CPU所花费的时间

总结:总的cpu时间totalCpuTime = user + nice + system + idle + iowait + irq + softirq + stealstolen + guest
/proc/pid/stat文件

该文件包含了某一进程所有的活动的信息,该文件中的所有值都是从系统启动开始累计到当前时刻

1
2
~$ cat /proc/6873/stat
6873 (a.out) R 6723 6873 6723 34819 6873 8388608 77 0 0 0 41958 31 0 0 25 0 3 0 5882654 1409024 56 4294967295 134512640 134513720 3215579040 0 2097798 0 0 0 0 0 0 0 17 0 0 0

以下只解释对我们计算Cpu使用率有用相关参数

参数 解析
pid=6873 进程号
utime=1587 该任务在用户态运行的时间,单位为jiffies
stime=41958 该任务在核心态运行的时间,单位为jiffies
cutime=0 所有已死线程在用户态运行的时间,单位为jiffies
cstime=0 所有已死在核心态运行的时间,单位为jiffies

结论:进程的总Cpu时间processCpuTime = utime + stime + cutime + cstime,该值包括其所有线程的cpu时间。
CPU采样的代码如下:

1
2
3
4
5
6
7
8
9
10
11
12
13
14
15
16
17
18
19
20
21
22
23
24
25
26
27
28
29
30
31
32
33
34
35
36
37
38
39
40
41
42
43
44
45
46
47
48
49
50
51
52
53
54
55
56
57
58
59
60
61
62
63
64
65
66
67
68
69
70
71
72
73
74
75
76
77
78
79
80
81
82
83
84
85
86
87
88
89
90
91
92
93
94
95
96
97
98
99
100
101
102
103
104
@Override
protected void doSample() {
BufferedReader cpuReader = null;
BufferedReader pidReader = null;

try {
cpuReader = new BufferedReader(new InputStreamReader(
new FileInputStream("/proc/stat")), BUFFER_SIZE);
String cpuRate = cpuReader.readLine();
if (cpuRate == null) {
cpuRate = "";
}

if (mPid == 0) {
mPid = android.os.Process.myPid();
}
pidReader = new BufferedReader(new InputStreamReader(
new FileInputStream("/proc/" + mPid + "/stat")), BUFFER_SIZE);
String pidCpuRate = pidReader.readLine();
if (pidCpuRate == null) {
pidCpuRate = "";
}

parse(cpuRate, pidCpuRate);
} catch (Throwable throwable) {
Log.e(TAG, "doSample: ", throwable);
} finally {
try {
if (cpuReader != null) {
cpuReader.close();
}
if (pidReader != null) {
pidReader.close();
}
} catch (IOException exception) {
Log.e(TAG, "doSample: ", exception);
}
}
}

private void parse(String cpuRate, String pidCpuRate) {
String[] cpuInfoArray = cpuRate.split(" ");
if (cpuInfoArray.length < 9) {
return;
}

long user = Long.parseLong(cpuInfoArray[2]);
long nice = Long.parseLong(cpuInfoArray[3]);
long system = Long.parseLong(cpuInfoArray[4]);
long idle = Long.parseLong(cpuInfoArray[5]);
long ioWait = Long.parseLong(cpuInfoArray[6]);
long total = user + nice + system + idle + ioWait
+ Long.parseLong(cpuInfoArray[7])
+ Long.parseLong(cpuInfoArray[8]);

String[] pidCpuInfoList = pidCpuRate.split(" ");
if (pidCpuInfoList.length < 17) {
return;
}

long appCpuTime = Long.parseLong(pidCpuInfoList[13])
+ Long.parseLong(pidCpuInfoList[14])
+ Long.parseLong(pidCpuInfoList[15])
+ Long.parseLong(pidCpuInfoList[16]);

if (mTotalLast != 0) {
StringBuilder stringBuilder = new StringBuilder();
long idleTime = idle - mIdleLast;
long totalTime = total - mTotalLast;

stringBuilder
.append("cpu:")
.append((totalTime - idleTime) * 100L / totalTime)
.append("% ")
.append("app:")
.append((appCpuTime - mAppCpuTimeLast) * 100L / totalTime)
.append("% ")
.append("[")
.append("user:").append((user - mUserLast) * 100L / totalTime)
.append("% ")
.append("system:").append((system - mSystemLast) * 100L / totalTime)
.append("% ")
.append("ioWait:").append((ioWait - mIoWaitLast) * 100L / totalTime)
.append("% ]");

synchronized (mCpuInfoEntries) {
mCpuInfoEntries.put(System.currentTimeMillis(), stringBuilder.toString());
if (mCpuInfoEntries.size() > MAX_ENTRY_COUNT) {
for (Map.Entry<Long, String> entry : mCpuInfoEntries.entrySet()) {
Long key = entry.getKey();
mCpuInfoEntries.remove(key);
break;
}
}
}
}
mUserLast = user;
mSystemLast = system;
mIdleLast = idle;
mIoWaitLast = ioWait;
mTotalLast = total;

mAppCpuTimeLast = appCpuTime;
}

卡顿条件判断及事后处理

当LooperMonitor第二次调用时,会判断第二次与第一次的时间间隔是否会超过阀值。

1
2
3
private boolean isBlock(long endTime) {
return endTime - mStartTimestamp > mBlockThresholdMillis;
}

若超过,将视作一次卡顿。满足卡顿条件将会调用下面方法

1
2
3
4
5
6
7
8
9
10
11
private void notifyBlockEvent(final long endTime) {
final long startTime = mStartTimestamp;
final long startThreadTime = mStartThreadTimestamp;
final long endThreadTime = SystemClock.currentThreadTimeMillis();
HandlerThreadFactory.getWriteLogThreadHandler().post(new Runnable() {
@Override
public void run() {
mBlockListener.onBlockEvent(startTime, endTime, startThreadTime, endThreadTime);
}
});
}

可以看到日志的写入执行在工作线程(HandlerThread),将回调BlockListener#onBlockEvent

pic1

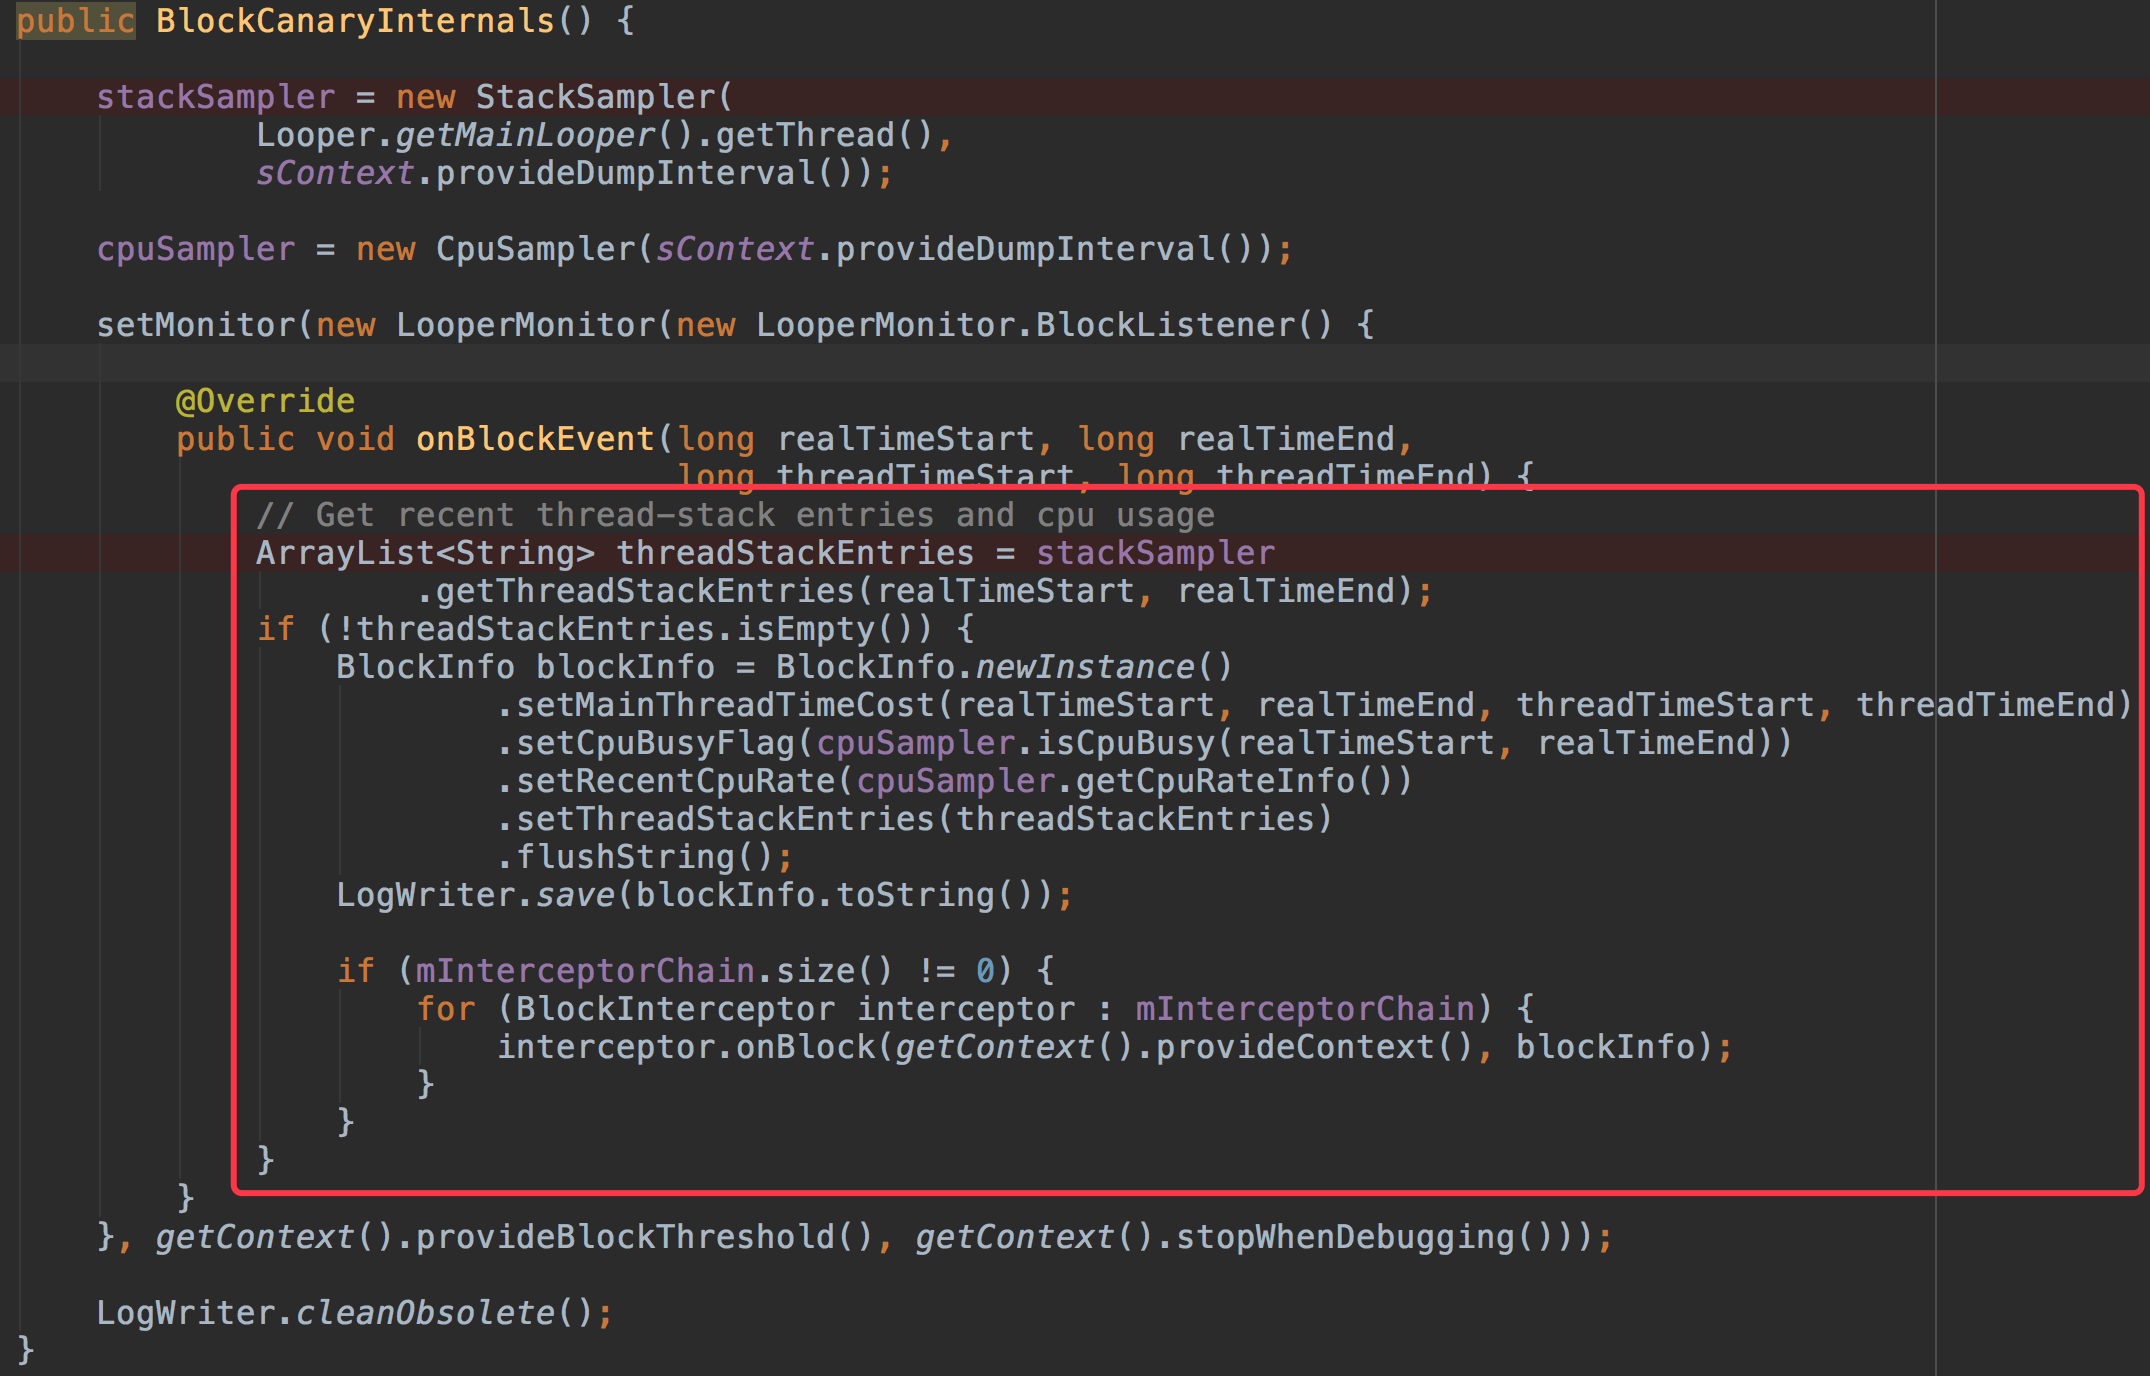
将堆栈采样和CPU采样数据封装为一个BlockInfo。

接下来将进行卡顿事后处理。

主要有两件事情:

  • 将卡顿发生时的堆栈和CPU信息写入日志;
  • 如果开启走通知栏,那么将发出一条通知栏消息;

卡顿日志记录

通过LogWriter.save(blockInfo.toString())完成

1
2
3
4
5
6
7
8
9
10
11
12
13
14
15
16
17
18
19
20
21
22
23
24
25
26
27
28
29
30
31
32
33
34
35
36
37
38
39
40
41
42
43
44
45
46
47
48
49
public static String save(String str) {
String path;
synchronized (SAVE_DELETE_LOCK) {
path = save("looper", str);
}
return path;
}

private static String save(String logFileName, String str) {
String path = "";
BufferedWriter writer = null;
try {
File file = BlockCanaryInternals.detectedBlockDirectory();
long time = System.currentTimeMillis();
path = file.getAbsolutePath() + "/"
+ logFileName + "-"
+ FILE_NAME_FORMATTER.format(time) + ".log";

OutputStreamWriter out =
new OutputStreamWriter(new FileOutputStream(path, true), "UTF-8");

writer = new BufferedWriter(out);

writer.write(BlockInfo.SEPARATOR);
writer.write("**********************");
writer.write(BlockInfo.SEPARATOR);
writer.write(TIME_FORMATTER.format(time) + "(write log time)");
writer.write(BlockInfo.SEPARATOR);
writer.write(str);
writer.write(BlockInfo.SEPARATOR);

writer.flush();
writer.close();
writer = null;

} catch (Throwable t) {
Log.e(TAG, "save: ", t);
} finally {
try {
if (writer != null) {
writer.close();
}
} catch (Exception e) {
Log.e(TAG, "save: ", e);
}
}
return path;
}

注意:以上代码的调用执行在工作线程HandlerThread(writer)中

通知栏消息

通知栏消息由下面代码触发

1
2
3
4
5
if (mInterceptorChain.size() != 0) {
for (BlockInterceptor interceptor : mInterceptorChain) {
interceptor.onBlock(getContext().provideContext(), blockInfo);
}
}

其中BlockInterceptor的一个实现类为DisplayService

1
2
3
4
5
6
7
8
9
10
11
12
13
14
15
16
17
18
19
20
21
22
23
24
25
26
27
28
29
30
31
32
33
34
35
36
37
38
39
40
41
42
43
44
45
46
47
48
49
50
51
52
final class DisplayService implements BlockInterceptor {

private static final String TAG = "DisplayService";

@Override
public void onBlock(Context context, BlockInfo blockInfo) {
Intent intent = new Intent(context, DisplayActivity.class);
intent.putExtra("show_latest", blockInfo.timeStart);
intent.setFlags(Intent.FLAG_ACTIVITY_NEW_TASK | Intent.FLAG_ACTIVITY_CLEAR_TOP);
PendingIntent pendingIntent = PendingIntent.getActivity(context, 1, intent, FLAG_UPDATE_CURRENT);
String contentTitle = context.getString(R.string.block_canary_class_has_blocked, blockInfo.timeStart);
String contentText = context.getString(R.string.block_canary_notification_message);
show(context, contentTitle, contentText, pendingIntent);
}

@TargetApi(HONEYCOMB)
private void show(Context context, String contentTitle, String contentText, PendingIntent pendingIntent) {
NotificationManager notificationManager = (NotificationManager)
context.getSystemService(Context.NOTIFICATION_SERVICE);

Notification notification;
if (SDK_INT < HONEYCOMB) {
notification = new Notification();
notification.icon = R.drawable.block_canary_notification;
notification.when = System.currentTimeMillis();
notification.flags |= Notification.FLAG_AUTO_CANCEL;
notification.defaults = Notification.DEFAULT_SOUND;
try {
Method deprecatedMethod = notification.getClass().getMethod("setLatestEventInfo", Context.class, CharSequence.class, CharSequence.class, PendingIntent.class);
deprecatedMethod.invoke(notification, context, contentTitle, contentText, pendingIntent);
} catch (NoSuchMethodException | IllegalAccessException | IllegalArgumentException
| InvocationTargetException e) {
Log.w(TAG, "Method not found", e);
}
} else {
Notification.Builder builder = new Notification.Builder(context)
.setSmallIcon(R.drawable.block_canary_notification)
.setWhen(System.currentTimeMillis())
.setContentTitle(contentTitle)
.setContentText(contentText)
.setAutoCancel(true)
.setContentIntent(pendingIntent)
.setDefaults(Notification.DEFAULT_SOUND);
if (SDK_INT < JELLY_BEAN) {
notification = builder.getNotification();
} else {
notification = builder.build();
}
}
notificationManager.notify(0xDEAFBEEF, notification);
}
}

参考资料

博主总结

博主在看过转载这篇博客后,总结如下:

BlockCanary原理是通过在主线程Handler中调用dispatchMessage方法的前后,通过Printer打印日志的地方,分别开始或者结束计时/堆栈dump/cpu采样,最终通过计算该方法耗时判断是否发生了主线程卡顿,并上报相关信息